Andrew Smith
SPL Graph Customer Service

- SPL Graph Customer Service
- SPL Graph App Comments & Reviews (2026)
- SPL Graph iPhone Images
- SPL Graph iPad Images
SPL Graph is an audio Sound Pressure Level (SPL) environmental noise analyzer, real-time frequency analyzer, chart recorder and data logger. It includes:
* Plot sound level over time
* Record audio while plot is running, playback to identify sounds that may have caused problems
* Capture video of events (optional in-app purchase)
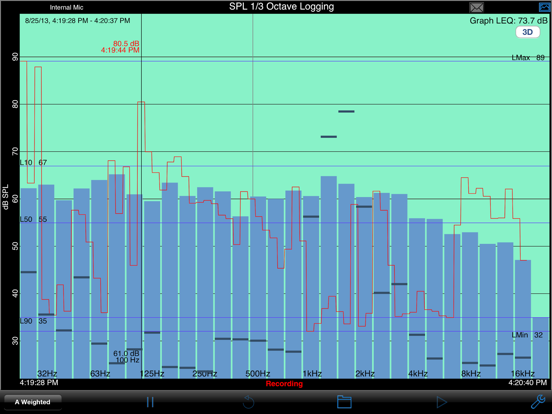
* Do octave and 1/3 octave band analysis (optional in-app purchase)
* Show a 3D Plot of octave or 1/3 octave results
* Calculate Ln SPL values, L01, L10, L50, L90, L95, LMax and LMin
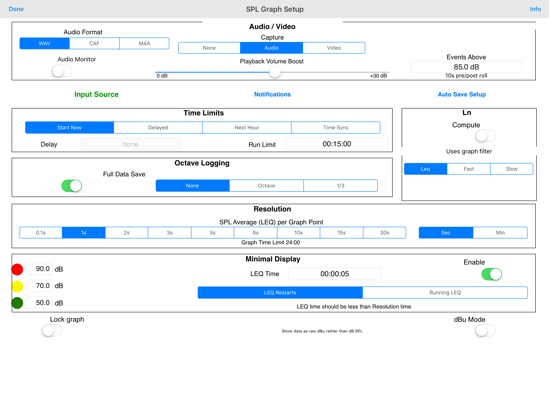
* Email notifications when sound exceeds pre-set limits
* Auto-save results after set intervals, and email the results to you
* Start another plot after auto-saving for continuous operation
SPL Graph works by averaging the SPL for a period of time that can vary from 0.1 second to 60 minutes, applying an optional weighting filter, and plotting the sound level, recording the raw audio signal, if recording is turned on.
For sound intervals of 1.0 second to 60 minutes, the optional octave and 1/3 octave logging modules allows storing the spectrum of the sound, for each interval.
The app works very well with the built-in iOS device microphone. To upgrade the app to true professional standards, add our iTestMic, iPrecisionMic, or iAudioInterface2 with an appropriate microphone, and get ANSI or ISO Type 1 or 2 results. With iPrecisionMic, you can send the system in to our calibration lab and get a calibration certificate for ISO 61672 and ANSI S1.4.
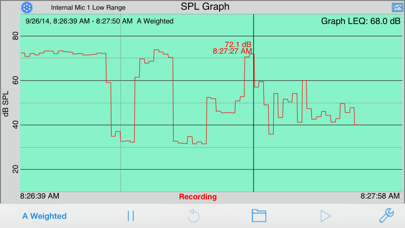
SPL Graph can record up to 24 hours of sound level data, with single second resolution. The graph starts with a one-minute plot window, and as a minute is recorded, the graph re-scales automatically and adds another minute to show the data collected so far. The overall SPL level, or LEQ, is displayed for whatever portion of the test is showing on the graph.
Tap the play button to play back the recorded audio, and you can use the cursor to scrub the audio location on the graph. Use this feature to listen to events that you can see on the graph.
With the optional octave logging module, you can also record the octave or 1/3 octave band levels. And, you can view the data on the 3D plot for a graphical view of frequency over time.
You can scroll and scale the graph vertically, in dB, by using standard swipe and pinch gestures. You can also scroll and expand and contract the time axis using gestures. Zoom out to a full 24 hours, or zoom in to a single minute, showing second resolution. Double-tap the screen to zoom out to show the entire graph on the screen.
The time scale grid changes dynamically, highlighting minutes, ten-minute, and hour lines as as it runs.
As the graph runs, the overall LEQ (average SPL) for the entire time period is computed and displayed on the screen. Swiping across the graph brings up a cursor that displays the exact dB level and time for any point on the graph.
You can turn on audio recording, so that you have a record of the sounds that were happening while the graph was being stored. You can use this to figure out exactly what the sound was that caused a peak on the graph, for example. Recordings can be compressed or uncompressed.
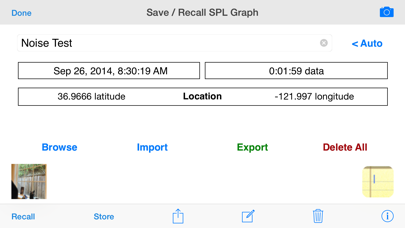
If you exit the app, or are interrupted with a phone call, the graph data will not be lost. SPL Graph will automatically save the graph, and reload it when you next open the program. You can also save a graph in one of ten files on the iPhone, so that you can recall the graph later.
SPL Graph supports saving graphs directly on your iOS device. You can recall these graphs and bring them up on the screen, and listen to the sounds that were made while the graph was recorded. You can also store an image of the screen to your photo roll. Use Dropbox or iTunes Files Sharing to export the results to your computer.
You can also export data in tab-delimited files for XLS import using iCloud.
The filters are all ANSI type 1 or better, and include A-weighting, C-weighting, and all octaves band filters from 32 to 16kHz.
SPL Graph App Comments & Reviews
SPL Graph Positive Reviews
Excellent appI've found many uses for this application, the most valuable being the ability to measure sound exposure in various environments. I hope the developer will consider adding the ability to graph peak spl exposure concurrent to average spl. This is the only reason why I did not add a fifth star. Otherwise the interface is stable, effective, and easy to use..Version: 0
Using for energy use assessmenI am so pleased with this app, even though i am using only a tiny part of its functionality. I set it up with my phone to record and save 15 second average intervals of the sound level near my gas water heater. I now have a timed record of its activity to compare to the usage data on my smart meter. This is a sanity check on my gas bill and whether the gas meter i am being charged from is really mine or if it belongs to another unit (multifamily building). Thanks for writing and maintaining this app!.Version: 9.0
Crashes with iOS 4.3.3Great app but it crashes with iOS 4.3.3 when trying to adjust db calibration. An iPad version would be nice to have!.Version: 2.2
This is the best sound meter app that II really appreciate the graph and the ability to save the graph image. The app saves a screen capture of the graph image to your iPhone camera roll so you can document your readings. Worth the price!.Version: 2.2
Live Venue Aid!Great tool for finding "dead spots" while balancing systems! Giving me indicators where to aim speakers for even coverage. A+++ app. Can't wait for the interface!.Version: 0
Free International Money Transfer 💸Enjoy high maximum transfers into more than 20 currencies while saving up to 90% over local banks! The cheap, fast way to send money abroad. Free transfer up to 500 USD!Version: 9.0